
How to Find All Restaurants in a City Using Google Maps Data

Whether you're scouting locations for a new restaurant, planning a real estate investment, or just curious about local business density, one question often comes up:
How can I find all the restaurants in a specific city?
You could scroll through Google Maps manually, but that’s time-consuming and incomplete. Business platforms like Yelp or TripAdvisor show only curated results.
If you want a complete, structured, and up-to-date list of restaurants in any city, the best option is to extract the data directly from Google Maps using an API.
In this guide, we’ll walk you through how to do exactly that.
Why You’d Want a Complete List of Restaurants
Let’s say Palo Alto is one of the most competitive restaurant markets in California, surrounded by affluent neighborhoods, tech campuses, and high foot traffic. Knowing the actual number of restaurants in the area helps with:
-
Site selection for new food businesses
-
Comparative analysis across neighborhoods
-
Retail leasing decisions
-
Identifying underserved locations
How to Check the Number of Restaurants Using Google Maps + API
Google Maps shows you restaurant listings, but doesn’t give an exact number, especially if you want to track changes over time or compare multiple areas.
The workaround? Use a scraping API that pulls all restaurant data from a specific map area. In this blog, we will use Unwrangle’s Google Map Search Scraper.
Prerequisites
Before starting, make sure you have:
Python 3.7 or higher installed
A valid API key from Unwrangle (sign up at www.unwrangle.com to get one)
Installed the following libraries:
Step 1: Create a Scraping Job for Restaurants in Palo Alto
The script below sends a request to Unwrangle’s scraping engine to fetch business listings for the search term "restaurants in Palo Alto". It uses geographic coordinates and a zoom level to target the right area.
Step 2: Wait for the Job to Complete
After the job is created, you need to wait until the scraper has completed. The script polls the job status every few seconds.
Step 3: Download and Save Results
Once the job is completed, retrieve the business listing results and export them to a CSV.
What You Can Get from the Unwrangle API Response
Each restaurant listing comes with key identifiers like place_id, cid, and data_id for easy reference. The name and description provide a quick snapshot of the business. Reviews are organized with a breakdown of ratings, key review keywords, and featured content, all accessible via a direct reviews_link. The primary main_category and additional categories help contextualize the business, while the rating reflects user feedback.
Popular times and operating hours are tracked through popular_times and most_popular_times, with details on closed days (closed_on) and daily operation hours (workday_timing). Business location and contact details include address, coordinates, and phone, alongside links to the restaurant’s official website and Google Maps listing.
The restaurant’s menu is accessible via the menu link, and online ordering options are available through order_online_links. Images of the restaurant are featured under featured_image and images, and the business’s status (open or closed) is noted in status. Further insights include whether the business can be claimed, ownership verification, and whether it's running paid ads on Google (is_spending_on_ads).
Visualizing and Analyzing Restaurant Data from Google Maps
Once we’ve scraped the restaurant listings for Palo Alto and saved them to a CSV, the next step is to perform geospatial and statistical analysis to extract insights.
1. Preparing the Data
First nstalled the following libraries:
Afterwards, load the dataset (JOB_ID.csv). Drop rows with missing coordinates. Convert to a GeoDataFrame using shapely.geometry.Point. Reproject to Web Mercator (EPSG:3857) for basemap compatibility.
Code:
2. Mapping Restaurants by Rating
Plot all restaurants on a map of Palo Alto, color-coded by rating.
Key Points:
-
Uses GeoPandas and Contextily.
-
Ratings are visualized using a color gradient.
Code:
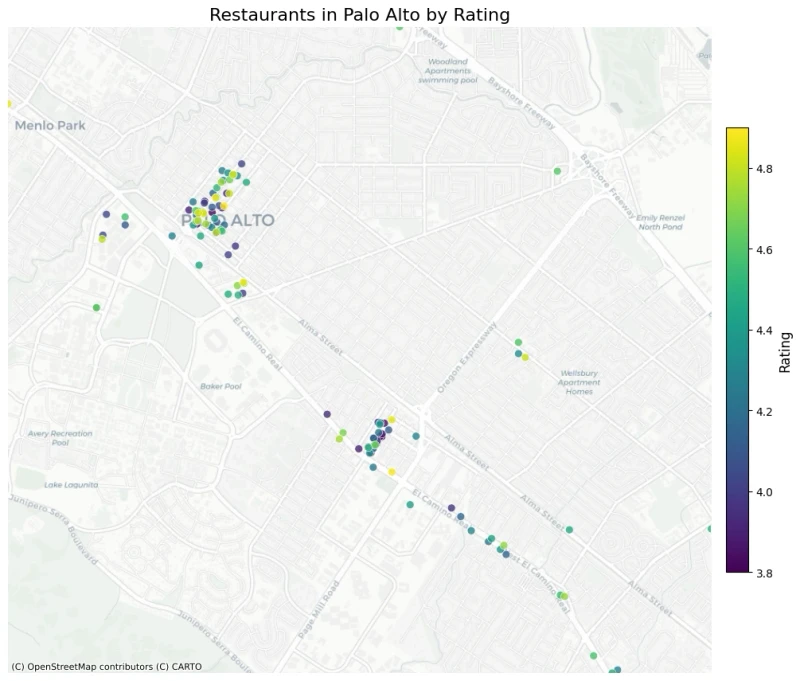
The rating map shows that top-rated restaurants (yellow/light green dots) are mostly found in downtown. It is not just the busiest area but also where quality tends to be higher.
In contrast, El Camino Real shows more mixed ratings. It is dense but less consistent in quality compared to downtown.
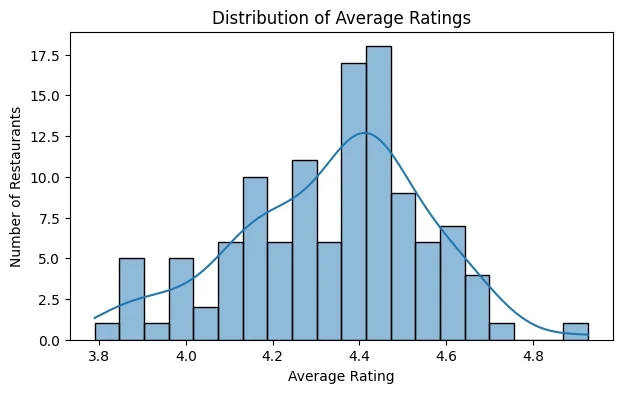
The ratings histogram shows that most restaurants are between 4.2 and 4.5 stars, with a peak around 4.4. The distribution leans slightly left, meaning there are a few more spots rated above average than below.
3. Analyzing Review Distribution
Calculate and visualize average ratings using review counts per star.
Key Points:
Weighted average is computed from reviews_per_rating_1 to reviews_per_rating_5.
A histogram shows how average ratings are distributed.
Code:
Most of the reviews fall within the 4-5 star range. This suggests that Palo Alto’s restaurants generally meet or exceed customer expectations. A high volume of positive reviews signals a strong local food scene where customers are largely satisfied with their dining experiences.
4. Category Distribution Map
Visualize restaurants by main category on a map.
Key Points:
-
Uses custom colors per category.
-
Helps identify location-based clustering by cuisine or type.
Code:
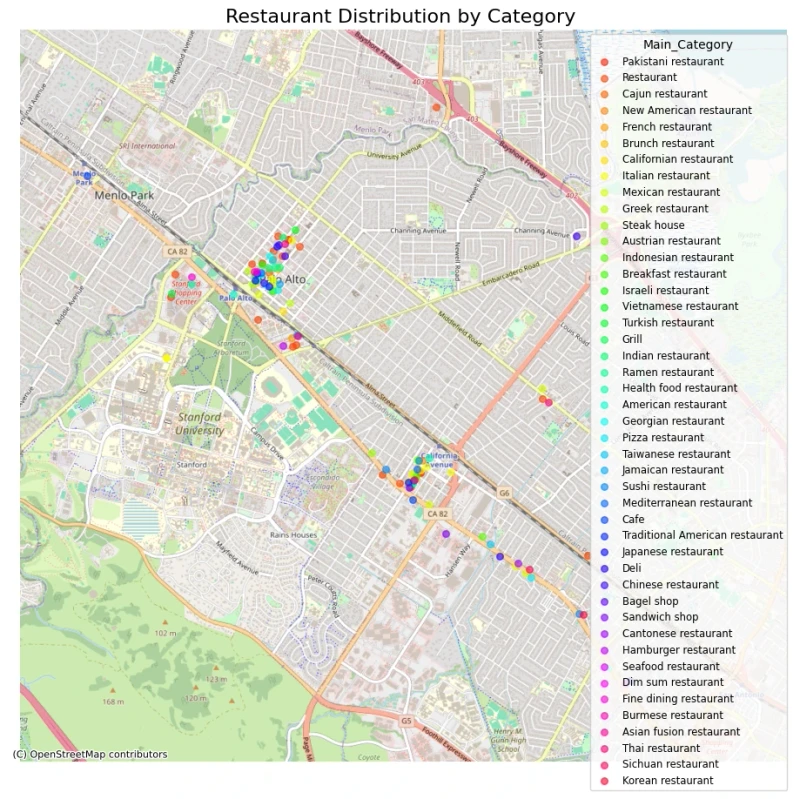
The category distribution map shows a wide range of cuisines across Palo Alto. Downtown stands out—not just dense but diverse.
Certain cuisines tend to cluster in specific areas. You might see a group of Asian restaurants or cafes near office spaces. Overlaying this with the density map gives a clearer picture of how location and food type align.
5. Hourly Popularity Trends
Analyze crowd levels by hour across all restaurants using popularity data.
Key Points:
-
Extracts and averages most_popular_times JSON entries.
-
Displays a line chart of average popularity by hour (0–23).
Code:
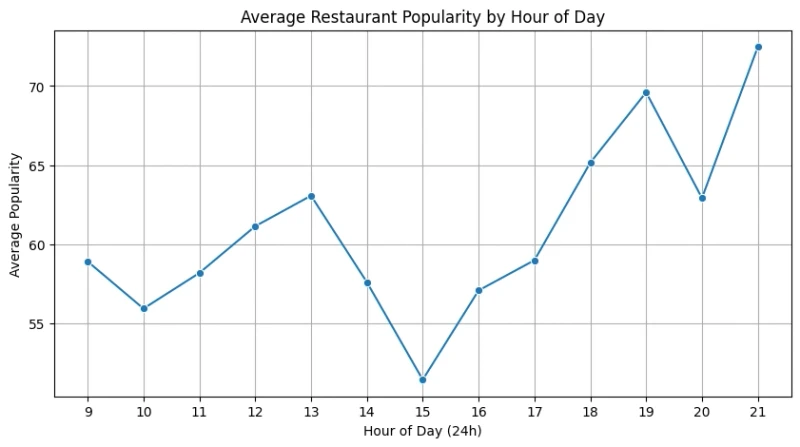
The average popularity by hour graph highlights two clear peaks:
-
Lunchtime around 1 PM
-
Dinnertime around 7 PM
There is a quiet period in the mid-afternoon and lower traffic in the morning and late evening.
These trends are consistent with what you would expect in a city like Palo Alto. Office workers, students, and locals are eating out during standard mealtimes.
6. Visualizing Restaurant Density (KDE Heatmap)
Create a heatmap showing restaurant density using kernel density estimation.
Key Points:
-
KDE helps highlight restaurant hotspots.
-
Plots both contour density and individual points on a map.
Code:
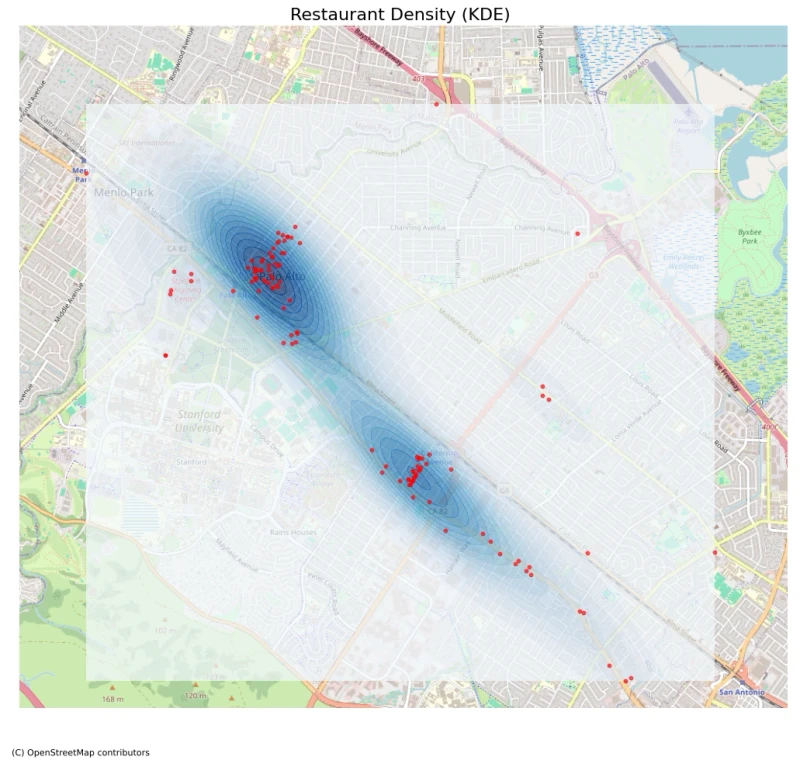
Most restaurants in Palo Alto are centered in downtown. This area stands out as the city’s main food hub. It’s where you will find the highest density of dining spots on both the locations map and the restaurant density (KDE) map.
There is also a strong linear spread along El Camino Real, a major road lined with restaurants. Outside these main zones, you will see smaller clusters in neighborhoods, likely serving local communities and business parks.
Final Thoughts
Using Google Maps data to find all restaurants in a city provides a powerful way to analyze the local food scene. By mapping restaurant locations, ratings, and categories, businesses can identify key areas to target for growth, while consumers get an easy way to find top-rated spots. The restaurant density and popular time insights further help businesses understand traffic patterns and peak dining hours.
Overall, this approach offers valuable data that can guide decision-making for both business expansion and consumer experiences. The ability to visualize and analyze restaurant data helps uncover trends and opportunities that might otherwise go unnoticed.