
Review Analysis: AI Tools & Process for Sentiment & Product Reviews

Reading customer reviews might sound simple, but truly understanding what they say about your product is a different story.
Thousands of reviews show up every day on Amazon, Walmart, BestBuy, and more. Some tell you exactly what’s working. Others hint at problems that could become major issues later.
And that’s where review analysis steps in.
Instead of just looking at star ratings or picking out random quotes, review analysis gives you a way to find patterns, map customer sentiment, and uncover insights hidden in the noise.
The best part?
Thanks to advancements in AI models like GPT-4 and scraping tools like Unwrangle’s ecommerce API, what once took teams of data scientists can now be done with lightweight models, clean datasets, and smart workflows.
In this guide, we will show you exactly how to build a modern review analysis pipeline from scratch.
Here is the playbook we will follow:
-
Identify keywords for the product
-
Scrape search results from top retailers
-
Scrape product details to gather brand and category information
-
Filter products of interest
-
Scrape reviews across multiple retail sites
-
Consolidate all reviews into a single dataset
-
Use GPT-4o or o3-mini models to run aspect-based sentiment analysis (ABSA)
-
Process the ABSA output and identify unique aspects
-
Cluster similar topics together (for example, "battery life" and "charging speed")
-
Visualize sentiment and clusters for each product to benchmark and compare
What Is Review Analysis?
Review analysis refers to the structured examination of unstructured customer reviews to uncover patterns, sentiment, and actionable insights. It falls under the broader category of Voice of Customer (VoC) analysis and product review analysis, commonly used in product intelligence, support automation, and customer experience design.
This process involves systematically gathering and interpreting feedback from various sources, such as product reviews, app store ratings, restaurant reviews, software evaluations, and marketplace seller ratings.
Rather than just tallying the number of stars or overall ratings, review analysis focuses on the actual content of user feedback, providing a deeper, more comprehensive understanding of the customer experience.
The goal is to comprehend customer sentiment, identify recurring themes across reviews, and link these themes directly to specific product features or aspects. Effective review analysis addresses questions such as:
-
What themes emerge across hundreds or thousands of reviews?
-
What aspects are driving loyalty, satisfaction, or churn?
-
What sentiment is attached to the different aspects of the product?
For over a decade, companies like Wonderflow, Revuze, and Monkeylearn have empowered large enterprises to perform review analysis using advanced Natural Language Processing (NLP) techniques, including:
-
Aspect-Based Sentiment Analysis (ABSA)
-
Topic modeling using LDA or BERTopic
-
Hierarchical clustering of feedback themes
-
Named Entity Recognition (NER)
The aim is to go beyond basic sentiment categorization (positive, negative, or neutral). Sophisticated review analysis identifies specific topics discussed by customers, assesses the sentiment linked to those topics, and tracks which topics are trending upward or downward.
How Review Analysis Has Traditionally Been Done
For over a decade, the most forward-thinking companies have been turning customer feedback into strategy.
They called it review analysis, voice of customer analysis, or simply feedback analytics.
The core idea was always the same — use Natural Language Processing (NLP) to break down unstructured reviews and extract real answers.
Savvy teams leveraged techniques like:
-
Sentiment analysis to measure overall positivity or negativity
-
Topic modeling to surface the major themes
-
Aspect-based sentiment analysis (ABSA) to link sentiment to specific product features
-
Hierarchical clustering to group feedback into patterns that matter
The goal was to move beyond basic ratings and answer deeper questions:
-
What topics are customers talking about most?
-
What is the sentiment attached to each topic?
-
Which topics are trending up or down over time?
-
How does our feedback compare to competitors?
-
Where are the hidden outliers and opportunities?
Companies like Wonderflow, Revuze, and Monkeylearn built full platforms around this approach.
But for years, these solutions were expensive and reserved for large enterprises or tech giants with deep pockets.
How AI Is Transforming Feedback Analytics
Today, the landscape is completely different.
Thanks to advancements in AI models like GPT-4o and data platforms like Unwrangle, businesses of all sizes can now access the same capabilities that once required million-dollar setups.
It is no longer about building in-house NLP teams or custom pipelines.
It is about combining the right tools:
-
Scraping APIs like Unwrangle to gather large volumes of review data
-
GPT-4o or o3-mini models to perform aspect-based sentiment analysis
-
Python visualization libraries to clearly present findings
This shift means that even small and mid-sized businesses can now:
-
Perform large-scale Amazon product review analysis
-
Conduct sentiment analysis of customer feedback using machine learning models
-
Utilize Python scripts for product review sentiment analysis that are easy to integrate
Building a Review Analysis System Using GPT-4o And Unwrangle
To analyze customer sentiments, we first need a dataset. Instead of manually gathering hundreds or thousands of reviews, we automate the process using web scraping. This lets us efficiently extract structured data at scale, giving us enough insights to work with.
For this analysis, we’ll be using Unwrangle, an API that simplifies web scraping without worrying about proxies, CAPTCHAs, or website blocks. Our goal is to fetch laptop reviews from popular e-commerce platforms, bringing in key details such as:
- Star ratings (1 to 5)
- Review text (What customers are saying)
- Review date (To analyze trends over time)
Once we have this raw data, we’ll move on to cleaning and structuring it to make sense of customer sentiments.
Step 1: Fetching Review Data with Unwrangle API
We will use Python to write our logic to fetch data. We are going to utilize multithreading for faster performance.
We will scrap data from Amazon, Walmart, Target and BestBuy.
Tools & Setup
Before we start, install the required Python libraries:
pip install requests
We’ll be using:
requests: To fetch data from the API
csv: To store the scraped reviews
time: To add delays and avoid API rate limits
ThreadPoolExecutor: To speed up the scraping process using multithreading
API Key & Authentication
To interact with the Unwrangle API, you need an API key. You also need Amazon cookies for scraping Amazon reviews because Amazon requires authentication. Here's how you set up your credentials:
API_KEY = <your_unwrangle_api_key>
AMAZON_COOKIE = <your_amazon_cookie_here>
Note: Amazon cookie is only needed for Amazon scraping. You can learn more about Amazon Cookies part on our docs page.
We’ll scrape reviews from multiple pages per platform:
PAGES_PER_PLATFORM = {
    'amazon': 25,
    'walmart': 5,
    'target': 25,
    'bestbuy': 25
}
Here’s a list of sample product IDs from each platform that we used for the tutorial::
Amazon
B0DNWB6ZPD · B0CNKX4T3Q · B0C7MR5RDH · B0CDQTSSTR · B0DLHBGBW3 · B0DDHTPG2C · B0CBJ46QZX · B0B2D77YB8 · B0CSBYTH84 · B0D4RH9TN7
Walmart
2670414563 · 5098188190 · 5327171853 · 5113283436 · 5098188185 · 3193557250 · 5259688726 · 5328260468 · 5113175776 · 5042325033
Best Buy
6571082 · 6571057 · 6565837 · 6560989 · 6578933 · 6602776 · 6571364 · 6570143 · 6602767 · 6588662
How To Search for Products
Before scraping reviews, we need to search for products. The search_products function queries the Unwrangle API to get product listings based on a search query:
def search_products(query, platform, page=1):
    url = f'https://data.unwrangle.com/api/getter/?platform={platform}_search&search={query}&page={page}&api_key={API_KEY}'
    response = requests.get(url, timeout=30)
    return response.json().get('results', []) if response.status_code == 200 else []
Fetch Product Reviews
Once we have the product URLs, we need to fetch the customer reviews for each product. Reviews are usually paginated, so we loop through pages to collect all reviews.
The get_product_reviews function handles this:
def get_product_reviews(product_url, platform, max_pages=10):
    all_reviews = []
    for page in range(1, max_pages + 1):
        url = f'https://data.unwrangle.com/api/getter/?platform={platform}_reviews&url={product_url}&page={page}&api_key={API_KEY}'
        if platform == 'amazon':
            url += f'&cookie={AMAZON_COOKIE}'

        response = requests.get(url, timeout=30)
        if response.status_code == 200:
            reviews = response.json().get('reviews', [])
            if not reviews:
                break  # Stop if no more reviews
            all_reviews.extend(reviews)
        else:
            break  # Stop if there's an error
    return all_reviews
Here’s what happens in the function:
-
Loop through pages: The loop goes through each page (up to max_pages), fetching reviews.
-
Construct the URL: The URL for fetching reviews is built dynamically, and if scraping Amazon, the session cookie is appended.
-
API Request: A GET request is sent to fetch reviews.
-
Process the Response: If the request is successful, the reviews are added to the all_reviews list.
Storing Reviews in a CSV File
Once reviews are collected, we store them in a CSV file for easy analysis. The write_to_csv function does this:
import csv

def write_to_csv(data, platform):
    filename = f'{platform}_reviews.csv'
    keys = data[0].keys() if data else []  # Extract column names from the first review
    with open(filename, 'w', newline='', encoding='utf-8') as output_file:
        dict_writer = csv.DictWriter(output_file, fieldnames=keys)
        dict_writer.writeheader()  # Write column headers
        dict_writer.writerows(data)  # Write all reviews
    print(f"Data saved to {filename}")
This function:
-
Saves the reviews to a CSV file (e.g., amazon_reviews.csv).
-
Uses the first review's keys to determine the column names.
-
Writes all reviews to the CSV file.
Using Multithreading for Faster Scraping
To speed up the process, we use multithreading. Instead of scraping each product one by one, we can scrape multiple products at once using Python’s concurrent.futures.ThreadPoolExecutor.
Here's the process_product function that fetches reviews for a product:
from concurrent.futures import ThreadPoolExecutor, as_completed

def process_product(product, platform):
    product_url = product.get('url')
    reviews = get_product_reviews(product_url, platform)
    return [{
        'Product_Name': product.get('name'),
        'Review_Text': review.get('review_text'),
        'Rating': review.get('rating'),
        'Reviewer': review.get('author_name')
    } for review in reviews]
Now we use ThreadPoolExecutor to process multiple products simultaneously:
with ThreadPoolExecutor(max_workers=5) as executor:
    futures = []
    for page in range(1, num_pages + 1):
        products = search_products(search_query, platform, page)
        for product in products:
            futures.append(executor.submit(process_product, product, platform))

    all_reviews = []
    for future in as_completed(futures):
        all_reviews.extend(future.result())  # Collect the reviews
This method allows us to process multiple products concurrently, drastically reducing the time it takes to scrape reviews.
Finally, we combine everything into a single main function that:
def main():
    search_query = 'laptop'  # Example search term
    for platform, num_pages in PAGES_PER_PLATFORM.items():
        print(f"Scraping data from {platform.capitalize()}...")

        all_reviews = []  # List to store all reviews

        # Using ThreadPoolExecutor for parallel processing
        with ThreadPoolExecutor(max_workers=5) as executor:
            futures = []

            # Loop through multiple pages of search results
            for page in range(1, num_pages + 1):
                products = search_products(search_query, platform, page)

                # Submit tasks for each product
                for product in products:
                    futures.append(executor.submit(process_product, product, platform))

            # Collect results as threads complete
            for future in as_completed(futures):
                all_reviews.extend(future.result())

        # Save collected reviews to CSV
        write_to_csv(all_reviews, platform)

if __name__ == '__main__':
    main()
Step 2: Enriching data with OpenAI's GPT Model
We got all data we can from platforms, now we will use AI model to get more data out of data we have. We will enrich data for better understanding and further processing.
We will explore a Python-based sentiment analysis pipeline that leverages OpenAI's GPT model to evaluate customer reviews, categorize sentiments across various aspects, and extract keyword mentions using regular expressions.
Additionally, we use asyncio and aiohttp to make API calls asynchronously, enhancing performance.
Dependencies and Setup
First, we install the necessary Python libraries:
pip install pandas numpy asyncio aiohttp python-dotenv tqdm
Let's first breakdown code in sections before actually diving into code.
- Loads environment variables (for API keys) using dotenv.
- Defines aspect-specific keywords to track user feedback.
- Utilizes aiohttp for asynchronous API calls to OpenAI.
- Implements retry mechanisms for handling API rate limits.
- Processes product reviews in batches for efficiency.
- Extracts sentiment scores for various product aspects.
- Counts keyword occurrences to quantify mentions.
- Assigns a sentiment polarity label to each review.
Let's break down the key sections.
Loading Environment Variables
Environment variables are used to store API keys securely. The script loads them using:
from dotenv import load_dotenv
load_dotenv()
Defining Keywords for Sentiment Analysis
To categorize sentiment accurately, predefined aspect-specific keywords are used:
ASPECT_KEYWORDS = {
    "Battery_Life": ["battery", "charge", "power", "last", "life", "duration"],
    "Performance": ["speed", "fast", "slow", "performance", "processor", "lag"],
    "Display_Quality": ["screen", "display", "resolution", "brightness", "color"],
}
This helps in tracking mentions of different product aspects within reviews.
Now, as we are here working on laptops, these are words that comes to my mind when I think about actual product and what aspects I think about when I make actual purchase.
When you are doing similar kind of data enrichment, you are supposed to define for your specific product. More you know about product, better will be your data quality!
Making Asynchronous API Calls to OpenAI
When working with large datasets or processing multiple text inputs simultaneously, speed and efficiency become crucial. Instead of sending API requests sequentially, which can be slow and resource-intensive, we leverage asynchronous programming to make concurrent API calls.
OpenAI's API is a cloud-based service, meaning each request involves network latency. If we send requests sequentially, each one must wait for the previous one to complete, significantly slowing down the process. By using aiohttp, we can send multiple requests at the same time, drastically improving performance.
async def fetch_openai_response(session, review_text, retry_count=0):
    headers = {
        "Content-Type": "application/json",
        "Authorization": f"Bearer {OPENAI_API_KEY}"
    }

    payload = {
        "model": MODEL,
        "messages": [{"role": "user", "content": f"Analyze the review: {review_text}"}],
        "temperature": 0.1,
        "response_format": {"type": "json_object"}
    }

    async with session.post(OPENAI_API_URL, headers=headers, json=payload) as response:
        response_json = await response.json()
        return response_json
- sync def fetch_openai_response(...): This function is defined as an asynchronous coroutine using async def, allowing it to be executed concurrently.
- session.post(...): Uses an aiohttp.ClientSession to make a non-blocking HTTP request to OpenAI's API.
- Headers and Authorization:
Content-Type: application/jsonensures the request is in JSON format. - The API key is passed in the Authorization header for authentication.
- Payload Structure:
- model: MODEL specifies which OpenAI model to use.
- messages: It follows the standard OpenAI Chat API format, where we send a user prompt asking for review analysis.
- temperature: 0.1 controls randomness in responses; a lower value makes responses more deterministic.
- response_format:
{"type": "json_object"}ensures the API returns a structured JSON response. - Awaiting Response:
await response.json()waits for the API response asynchronously, preventing the script from blocking execution.
Benefits of This Approach
- Faster Execution: Since multiple API calls happen simultaneously, the script can handle hundreds of requests quickly.
- Efficient Resource Utilization: The program doesn't wait idly for each request to complete, making it ideal for batch processing.
- Scalability: Can be extended to handle error retries and rate limits effectively.
Note: This has sample function, actual prompt was bigger and can be found at bottom of this section.
Processing all reviews
process_reviews_batch processes a batch of product reviews asynchronously using OpenAI's API for sentiment analysis. It also calculates various text-based metrics, keyword counts, and sentiment polarity. Below is a breakdown with code snippets explaining each part.
Function definition The function takes two arguments:
async def process_reviews_batch(session: aiohttp.ClientSession,
                              reviews_batch: pd.DataFrame) -> List[Dict[str, Any]]:
session: Anaiohttp.ClientSessionfor making API calls asynchronously.reviews_batch: A Pandas DataFrame containing multiple reviews.
It returns a list of dictionaries, where each dictionary represents the processed review data.
Defining the Inner Function (process_single_review)
Inside this function, each review is processed individually:
async def process_single_review(idx, row):
idx: The index of the row in the DataFrame.row: The actual review data as a Pandas Series.
Extracting Review Information
We extract the review text and ID from the DataFrame, we skip if review is empty:
review_text = row['Review_Text']
review_id = row['Review_ID']

if pd.isna(review_text) or review_text == "":
    print(f"Skipping empty review with ID: {review_id}")
    return {}
Calling OpenAI API for Sentiment Analysis
This function fetches sentiment scores for different aspects (battery life, performance, etc.):
sentiment_data = await fetch_openai_response(session, review_text)
The API response is expected to be a dictionary containing sentiment scores.
Counting Aspect Mentions in the Review
Each aspect (like Battery Life, Performance) has predefined keywords stored in ASPECT_KEYWORDS. The function counts occurrences of these keywords:
aspect_counts = {}
for aspect, keywords in ASPECT_KEYWORDS.items():
    aspect_counts[f"{aspect}_Mention_Count"] = count_keyword_occurrences(review_text, keywords)
Similarly, additional keyword occurrences are counted:
keyword_hits = calculate_keyword_hits(review_text, ADDITIONAL_KEYWORDS)
keyword_hit_counts = sum(keyword_hits.values())
Calculating Text Metrics
The function calculates the review's word count and character count:
review_length_word_count = len(review_text.split()) if isinstance(review_text, str) else 0
review_length_char_count = len(review_text) if isinstance(review_text, str) else 0
Extracting Date Information
If the review has a timestamp, it extracts the month and year:
if pd.notna(row['Review_DateTime']):
    review_date = pd.to_datetime(row['Review_DateTime'])
    review_month = review_date.strftime('%B')
    review_year = review_date.year
else:
    review_month = None
    review_year = None
Determining Sentiment Polarity Label
Based on the sentiment score, the function classifies reviews as Positive, Neutral, or Negative:
sentiment_score = sentiment_data.get('overall_sentiment', 0)
if isinstance(sentiment_score, (int, float)):
    if sentiment_score > 0.3:
        sentiment_polarity = "Positive"
    elif sentiment_score < -0.3:
        sentiment_polarity = "Negative"
    else:
        sentiment_polarity = "Neutral"
else:
    sentiment_polarity = "Unknown"
Creating the Final Processed Review Dictionary
The function aggregates all computed data into a dictionary:
result = {
    'Review_ID': review_id,
    'Overall_Sentiment_Score': sentiment_data.get('overall_sentiment'),
    'Battery_Life_Sentiment_Score': sentiment_data.get('battery_life'),
    'Performance_Sentiment_Score': sentiment_data.get('performance'),
    'Display_Quality_Sentiment_Score': sentiment_data.get('display_quality'),
    'Build_Quality_Sentiment_Score': sentiment_data.get('build_quality'),
    'Keyboard_Touchpad_Sentiment_Score': sentiment_data.get('keyboard_touchpad'),
    'Portability_Sentiment_Score': sentiment_data.get('portability'),
    'Software_Experience_Sentiment_Score': sentiment_data.get('software_experience'),
    'Battery_Life_Mention_Count': aspect_counts.get('Battery_Life_Mention_Count', 0),
    'Performance_Mention_Count': aspect_counts.get('Performance_Mention_Count', 0),
    'Display_Quality_Mention_Count': aspect_counts.get('Display_Quality_Mention_Count', 0),
    'Build_Quality_Mention_Count': aspect_counts.get('Build_Quality_Mention_Count', 0),
    'Keyboard_Touchpad_Mention_Count': aspect_counts.get('Keyboard_Touchpad_Mention_Count', 0),
    'Portability_Mention_Count': aspect_counts.get('Portability_Mention_Count', 0),
    'Software_Experience_Mention_Count': aspect_counts.get('Software_Experience_Mention_Count', 0),
    'Keyword_Hit_Counts': keyword_hit_counts,
    'Review_Length_Word_Count': review_length_word_count,
    'Review_Length_Character_Count': review_length_char_count,
    'Review_Month': review_month,
    'Review_Year': review_year,
    'Sentiment_Polarity_Label': sentiment_polarity,
}
All original review columns are added back:
for col in row.index:
    if col not in result:
        result[col] = row[col]
We also add error handeling as usual.
except Exception as e:
    print(f"Error processing review {review_id}: {str(e)}")
    result = {'Review_ID': review_id, 'error': str(e)}
    for col in row.index:
        if col not in result:
            result[col] = row[col]
    return result
Processing the Batch Concurrently
Finally, the function processes all reviews in parallel using asyncio.gather:
tasks = [process_single_review(idx, row) for idx, row in reviews_batch.iterrows()]
results = await tqdm_asyncio.gather(*tasks, desc="Processing batch")
This efficiently processes multiple reviews at once instead of sequentially.
The function returns only non-empty results:
return [r for r in results if r]
Summary of this section:
- Fetches Sentiment Scores from OpenAI API.
- Counts Keyword Mentions for aspects like Battery Life, Performance, etc.
- Computes Text Metrics (word count, character count).
- Extracts Date Information (month and year).
- Determines Sentiment Polarity (Positive, Neutral, Negative).
- Processes All Reviews Concurrently for efficiency.
This approach allows scalable and efficient review processing while handling missing data and errors gracefully.
Here is complete code for data enrichment, replace OPENAI_API_KEY with your actual key. You can also use any other local or cloud based LLM with small changes:
import pandas as pd
import numpy as np
import asyncio
import aiohttp
import os
import json
import re
from datetime import datetime
from typing import List, Dict, Any, Tuple
from tqdm.asyncio import tqdm_asyncio
from dotenv import load_dotenv
import time
from sklearn.feature_extraction.text import TfidfVectorizer
from concurrent.futures import ThreadPoolExecutor

load_dotenv()

OPENAI_API_KEY = "YOUR_API_KEY"
OPENAI_API_URL = "https://api.openai.com/v1/chat/completions"
MODEL = "gpt-4o"
BATCH_SIZE = 100
MAX_RETRIES = 5
RETRY_DELAY = 5
ASPECT_KEYWORDS = {
    "Battery_Life": ["battery", "charge", "power", "last", "life", "duration"],
    "Performance": ["speed", "fast", "slow", "performance", "processor", "core", "lag", "boot",
                   "processing", "responsive", "bloatware", "copilot"],
    "Display_Quality": ["screen", "display", "resolution", "bright", "touch", "color", "glass"],
    "Build_Quality": ["build", "quality", "solid", "material", "durable", "sturdy", "condition"],
    "Keyboard_Touchpad": ["keyboard", "touchpad", "key", "type", "track", "pad", "click"],
    "Portability": ["portable", "light", "heavy", "weight", "slim", "thin", "size", "dimensions"],
    "Software_Experience": ["software", "windows", "system", "os", "program", "app", "feature", "operate"]
}

ADDITIONAL_KEYWORDS = [
    "overheating", "speed", "value", "price", "customer service", "warranty",
    "upgrade", "memory", "storage", "wifi", "bluetooth", "connectivity"
]

async def fetch_openai_response(session: aiohttp.ClientSession,
                              review_text: str,
                              retry_count: int = 0) -> Dict[str, Any]:
    headers = {
        "Content-Type": "application/json",
        "Authorization": f"Bearer {OPENAI_API_KEY}"
    }

    prompt = f"""
    Analyze the following product review and provide these scores:

    1. Overall sentiment score (range -1 to +1 where -1 is very negative, 0 is neutral, and +1 is very positive)

    2. For each of these aspects, provide:
       - Battery Life: sentiment score (-1 to +1)
       - Performance: sentiment score (-1 to +1)
       - Display Quality: sentiment score (-1 to +1)
       - Build Quality: sentiment score (-1 to +1)
       - Keyboard/Touchpad: sentiment score (-1 to +1)
       - Portability: sentiment score (-1 to +1)
       - Software Experience: sentiment score (-1 to +1)

    3. If any aspect is not mentioned in the review, assign null for that aspect.

    Review: "{review_text}"

    Return the results in a JSON format with these keys:
    overall_sentiment, battery_life, performance, display_quality, build_quality, keyboard_touchpad, portability, software_experience
    """

    payload = {
        "model": MODEL,
        "messages": [{"role": "user", "content": prompt}],
        "temperature": 0.1,
        "response_format": {"type": "json_object"}
    }

    try:
        async with session.post(OPENAI_API_URL, headers=headers, json=payload) as response:
            if response.status == 429:
                if retry_count < MAX_RETRIES:
                    print(f"Rate limit hit, retrying in {RETRY_DELAY} seconds...")
                    await asyncio.sleep(RETRY_DELAY * (2 ** retry_count))
                    return await fetch_openai_response(session, review_text, retry_count + 1)
                else:
                    print("Max retries exceeded")
                    return {"error": "rate_limit_exceeded"}

            response_json = await response.json()
            if "error" in response_json:
                print(f"API Error: {response_json['error']}")
                if retry_count < MAX_RETRIES:
                    print(f"Retrying in {RETRY_DELAY} seconds...")
                    await asyncio.sleep(RETRY_DELAY * (2 ** retry_count))
                    return await fetch_openai_response(session, review_text, retry_count + 1)
                return {"error": response_json['error']}

            try:
                content = response_json["choices"][0]["message"]["content"]
                return json.loads(content)
            except (KeyError, json.JSONDecodeError) as e:
                print(f"Error parsing API response: {e}")
                print(f"Response: {response_json}")
                return {"error": "parsing_error"}

    except Exception as e:
        print(f"Request error: {e}")
        if retry_count < MAX_RETRIES:
            print(f"Retrying in {RETRY_DELAY} seconds...")
            await asyncio.sleep(RETRY_DELAY * (2 ** retry_count))
            return await fetch_openai_response(session, review_text, retry_count + 1)
        return {"error": str(e)}

def count_keyword_occurrences(text: str, keywords: List[str]) -> int:
    if not text or not isinstance(text, str):
        return 0

    text = text.lower()
    count = 0
    for keyword in keywords:
        count += len(re.findall(r'\b' + re.escape(keyword.lower()) + r'\b', text))
    return count

def calculate_keyword_hits(text: str, keywords: List[str]) -> Dict[str, int]:
    if not text or not isinstance(text, str):
        return {keyword: 0 for keyword in keywords}

    text = text.lower()
    result = {}
    for keyword in keywords:
        result[keyword] = len(re.findall(r'\b' + re.escape(keyword.lower()) + r'\b', text))
    return result

async def process_reviews_batch(session: aiohttp.ClientSession,
                              reviews_batch: pd.DataFrame) -> List[Dict[str, Any]]:
    results = []

    async def process_single_review(idx, row):
        review_text = row['Review_Text']
        review_id = row['Review_ID']

        if pd.isna(review_text) or review_text == "":
            print(f"Skipping empty review with ID: {review_id}")
            return {}

        try:
            sentiment_data = await fetch_openai_response(session, review_text)

            aspect_counts = {}
            for aspect, keywords in ASPECT_KEYWORDS.items():
                aspect_counts[f"{aspect}_Mention_Count"] = count_keyword_occurrences(review_text, keywords)

            keyword_hits = calculate_keyword_hits(review_text, ADDITIONAL_KEYWORDS)
            keyword_hit_counts = sum(keyword_hits.values())

            review_length_word_count = len(review_text.split()) if isinstance(review_text, str) else 0
            review_length_char_count = len(review_text) if isinstance(review_text, str) else 0

            if pd.notna(row['Review_DateTime']):
                review_date = pd.to_datetime(row['Review_DateTime'])
                review_month = review_date.strftime('%B')
                review_year = review_date.year
            else:
                review_month = None
                review_year = None

            sentiment_score = sentiment_data.get('overall_sentiment', 0)
            if isinstance(sentiment_score, (int, float)):
                if sentiment_score > 0.3:
                    sentiment_polarity = "Positive"
                elif sentiment_score < -0.3:
                    sentiment_polarity = "Negative"
                else:
                    sentiment_polarity = "Neutral"
            else:
                sentiment_polarity = "Unknown"

            result = {
                'Review_ID': review_id,
                'Overall_Sentiment_Score': sentiment_data.get('overall_sentiment'),
                'Battery_Life_Sentiment_Score': sentiment_data.get('battery_life'),
                'Performance_Sentiment_Score': sentiment_data.get('performance'),
                'Display_Quality_Sentiment_Score': sentiment_data.get('display_quality'),
                'Build_Quality_Sentiment_Score': sentiment_data.get('build_quality'),
                'Keyboard_Touchpad_Sentiment_Score': sentiment_data.get('keyboard_touchpad'),
                'Portability_Sentiment_Score': sentiment_data.get('portability'),
                'Software_Experience_Sentiment_Score': sentiment_data.get('software_experience'),
                'Battery_Life_Mention_Count': aspect_counts.get('Battery_Life_Mention_Count', 0),
                'Performance_Mention_Count': aspect_counts.get('Performance_Mention_Count', 0),
                'Display_Quality_Mention_Count': aspect_counts.get('Display_Quality_Mention_Count', 0),
                'Build_Quality_Mention_Count': aspect_counts.get('Build_Quality_Mention_Count', 0),
                'Keyboard_Touchpad_Mention_Count': aspect_counts.get('Keyboard_Touchpad_Mention_Count', 0),
                'Portability_Mention_Count': aspect_counts.get('Portability_Mention_Count', 0),
                'Software_Experience_Mention_Count': aspect_counts.get('Software_Experience_Mention_Count', 0),
                'Keyword_Hit_Counts': keyword_hit_counts,
                'Review_Length_Word_Count': review_length_word_count,
                'Review_Length_Character_Count': review_length_char_count,
                'Review_Month': review_month,
                'Review_Year': review_year,
                'Sentiment_Polarity_Label': sentiment_polarity,
            }

            for col in row.index:
                if col not in result:
                    result[col] = row[col]

            return result

        except Exception as e:
            print(f"Error processing review {review_id}: {str(e)}")
            result = {'Review_ID': review_id, 'error': str(e)}
            for col in row.index:
                if col not in result:
                    result[col] = row[col]
            return result

    tasks = [process_single_review(idx, row) for idx, row in reviews_batch.iterrows()]
    results = await tqdm_asyncio.gather(*tasks, desc="Processing batch")

    return [r for r in results if r]

async def process_and_write_reviews(df: pd.DataFrame, output_file: str):
    total_reviews = len(df)
    batches = [df.iloc[i:i+BATCH_SIZE] for i in range(0, total_reviews, BATCH_SIZE)]

    connector = aiohttp.TCPConnector(limit=10)

    header_written = False
    mode = 'w'

    async with aiohttp.ClientSession(connector=connector) as session:
        for i, batch in enumerate(batches):
            print(f"Processing batch {i+1}/{len(batches)} ({len(batch)} reviews)")

            batch_results = await process_reviews_batch(session, batch)

            if batch_results:
                batch_df = pd.DataFrame(batch_results)

                if header_written:
                    batch_df.to_csv(output_file, mode='a', header=False, index=False)
                else:
                    batch_df.to_csv(output_file, mode=mode, header=True, index=False)
                    header_written = True
                    mode = 'a'

                print(f"Wrote batch {i+1} to {output_file} ({len(batch_results)} records)")

            if i < len(batches) - 1:
                await asyncio.sleep(0.1)

async def main():
    start_time = time.time()

    input_file = "./splitted_merged_csv/part_7.csv"
    intermediate_file = "./enriched_reviews_intermediate/part_7.csv"
    output_file = "./enriched_reviews_final/part_7.csv"

    print(f"Loading data from {input_file}...")
    df = pd.read_csv(input_file)

    print(f"Loaded {len(df)} reviews")

    print(f"Processing reviews and writing results to {intermediate_file}...")
    await process_and_write_reviews(df, intermediate_file)

    elapsed_time = time.time() - start_time
    print(f"Processing completed in {elapsed_time:.2f} seconds")
    print(f"Final enriched data saved to {output_file}")

if __name__ == "__main__":
    asyncio.run(main())
Now let's move to Voice of Customer, data visualization and business analytics for data we generated.
Step 3: Data Visualization and Analysis
In our example, we have collected and enriched laptop review data from multiple platforms. Now it is time to write script to visualize results and make informed opinions about same.
Let's start by analyzing rating over years.
We will use python's matplotlib and seaborn to create visualizations.
import pandas as pd
import matplotlib.pyplot as plt
import seaborn as sns

# Load data
df = pd.read_csv('data.csv')

# Convert to datetime and extract year
df['Review_DateTime'] = pd.to_datetime(df['Review_DateTime'], format='%Y-%m-%d')
df['Review_Year'] = df['Review_DateTime'].dt.to_period('Y')

# Group by year and calculate average rating
yearly_avg = df.groupby('Review_Year')['Star_Rating'].mean().reset_index()
yearly_avg['Review_Year'] = yearly_avg['Review_Year'].astype(str)

# Create plot
plt.figure(figsize=(10, 6))
sns.lineplot(x='Review_Year', y='Star_Rating', data=yearly_avg, marker='o', color='#4CAF50')

# Add labels and formatting
plt.title('Average Star Rating Trend (Yearly)')
plt.xlabel('Year')
plt.ylabel('Average Rating')
plt.xticks(rotation=45)
plt.grid(True, linestyle='--', alpha=0.5)

plt.tight_layout()
plt.show()
Here is what output looks like:
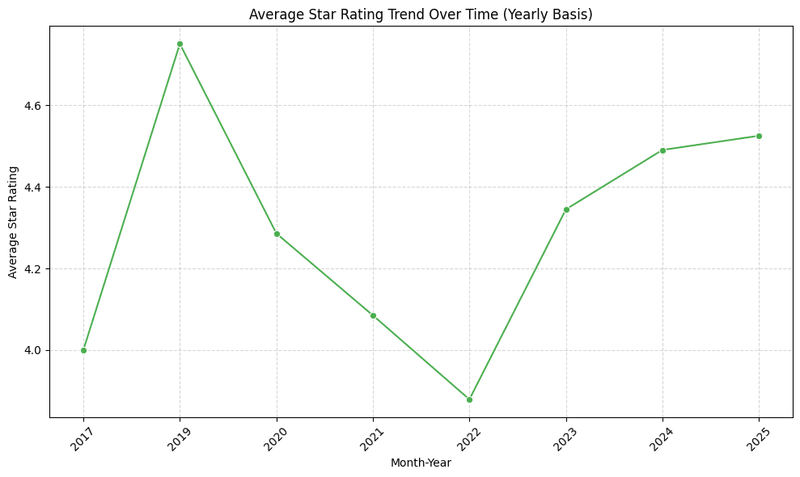
Now let's see what information can we get from this graph:
2017: 4.0 stars Laptops were satisfactory but unremarkable, reflecting a stable market without major innovations.
2018: 4.6 stars A peak driven by technological leaps like Intel’s 8th-gen processors and ultrabook designs, boosting user satisfaction.
2019: 4.4 stars A slight drop, possibly due to market saturation or heightened competition raising user expectations.
2020: 4.2 stars The COVID-19 pandemic hit, disrupting supply chains and quality amid surging demand for remote work, lowering ratings.
2021: 4.0 stars The lowest point, likely due to ongoing pandemic effects and the global semiconductor shortage affecting product quality.
2022: 4.2 stars Recovery began as supply chains stabilized and production adapted to post-pandemic needs.
2023: 4.4 stars Ratings rose with innovations like better processors and AI features meeting evolving consumer demands.
2024-2025: 4.5 stars Ratings stabilized as the market balanced quality and demand, reflecting post-pandemic recovery and tech advancements.
Key Influences: The trends tie to world factors—technological breakthroughs (2018), pandemic disruptions (2020-2021), and supply chain recovery with innovation (2022-2025)—shaping laptop ratings over time.
Okay, so here is what companies need to do in future to stay ahead in market.
- Focus on Continuous Innovation
Ratings peaked at 4.6 in 2018 due to technological breakthroughs but declined in 2019-2021, suggesting a slowdown in innovation. To regain momentum, companies must invest in research and development (R&D) for features like artificial intelligence (AI), improved battery life, and sustainable designs.
- Enhance Supply Chain Resilience
The drop in ratings to 4.0 in 2021 during the pandemic highlighted supply chain weaknesses. Companies should diversify suppliers, adopt flexible manufacturing processes, and maintain stockpiles of critical components to avoid future disruptions.
- Prioritize Customer Experience
Ratings stabilized at 4.5 in 2024-2025, showing customer satisfaction but also room for improvement. Enhancing support services, streamlining repairs, and offering personalized options can elevate the user experience.
Now let's analyze rating distribution in top 10 products (top 10 as per number of reviews):
import pandas as pd
import matplotlib.pyplot as plt
import seaborn as sns

# Load data
df = pd.read_csv('data.csv')

# Get top 10 products and filter dataset
top_products = df['Product_ID_Model'].value_counts().nlargest(10).index.tolist()
filtered_df = df[df['Product_ID_Model'].isin(top_products)]

# Get rating distribution
rating_distribution = filtered_df.groupby(['Product_ID_Model', 'Star_Rating']).size().reset_index(name='Count')

# Create plot
plt.figure(figsize=(12, 6))
sns.barplot(
    x='Product_ID_Model',
    y='Count',
    hue='Star_Rating',
    data=rating_distribution,
    palette='viridis'
)

# Add labels and formatting
plt.title('Rating Distribution by Product')
plt.xlabel('Product ID')
plt.ylabel('Review Count')
plt.xticks(rotation=45, ha='right')
plt.legend(title='Rating')

plt.tight_layout()
plt.show()
Here is output graph:
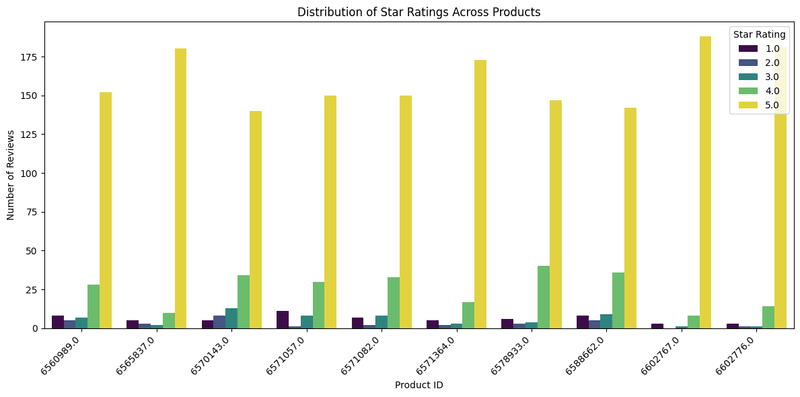
Strong Customer Satisfaction: All 10 products are highly rated, with 5.0-star reviews dominating (ranging from ~70 to ~135 reviews per product). This indicates that these products consistently meet or exceed customer expectations, reflecting strong product quality and a positive brand perception.
Limited Differentiation: The rating distributions are remarkably similar across all 10 products, with 5.0-star reviews leading, followed by ~25 reviews at 4.0 stars, and minimal lower ratings. This uniformity implies consistent quality but also a lack of standout products or unique selling points. If the business aims to highlight exceptional performers or drive innovation, this chart offers little insight due to the lack of variation.
Minor Areas for Improvement: Despite the positive ratings, each product has a small but consistent number of 1.0 to 3.0-star reviews (~5–10 each). This suggests minor dissatisfaction among a subset of customers. Investigating the reasons behind these lower ratings could uncover specific issues to address, potentially improving overall satisfaction and reducing negative feedback. We will discuss specific areas for improvement in further analysis which can unlock big market opportunities.
Now let's discuss for specific features and analysis.
Battery Life Analysis of Laptops
We will visualize graph for all products and for top-5 as per number of reviews and make conclusions as per same.
import pandas as pd
import matplotlib.pyplot as plt
import seaborn as sns

# Load data
df = pd.read_csv('data.csv')

# Convert to datetime and extract year
df['Review_DateTime'] = pd.to_datetime(df['Review_DateTime'], format='%Y-%m-%d')
df['Review_Year'] = df['Review_DateTime'].dt.to_period('Y')

# Convert sentiment score to numeric
df['Battery_Life_Sentiment_Score'] = pd.to_numeric(df['Battery_Life_Sentiment_Score'], errors='coerce')

# Group by year and calculate average sentiment
yearly_sentiment = df.groupby('Review_Year')['Battery_Life_Sentiment_Score'].mean().reset_index()
yearly_sentiment['Review_Year'] = yearly_sentiment['Review_Year'].astype(str)

# Create plot
plt.figure(figsize=(12, 6))
sns.lineplot(
   x='Review_Year',
   y='Battery_Life_Sentiment_Score',
   data=yearly_sentiment,
   marker='o',
   color='#FF5733'
)

# Add labels and formatting
plt.title('Yearly Battery Life Sentiment Trend')
plt.xlabel('Year')
plt.ylabel('Average Sentiment Score')
plt.xticks(rotation=45, ha='right')
plt.ylim(-1.0, 1)

plt.tight_layout()
plt.show()
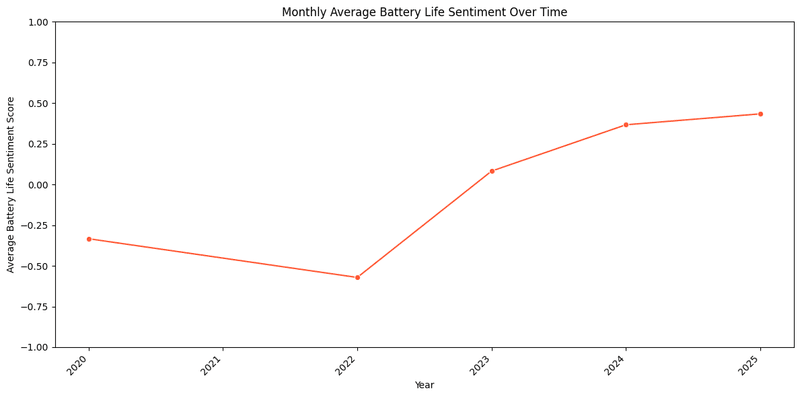
Here is output:
Now let's write script for top-5 products with most reviews.
import pandas as pd
import matplotlib.pyplot as plt
import seaborn as sns
from matplotlib.dates import DateFormatter, AutoDateLocator

# Load data
df = pd.read_csv('data.csv')
df['Review_DateTime'] = pd.to_datetime(df['Review_DateTime'])

# Get top 5 products
top_products = df['Product_ID_Model'].value_counts().nlargest(5).index.tolist()
filtered_df = df[df['Product_ID_Model'].isin(top_products)]

# Create month-year format and group
filtered_df['Month_Year'] = filtered_df['Review_DateTime'].dt.to_period('M').dt.strftime('%b-%Y')
product_monthly = filtered_df.groupby(['Product_ID_Model', 'Month_Year'])['Battery_Life_Sentiment_Score'].mean().reset_index()

# Convert to datetime for proper ordering
product_monthly['Date'] = pd.to_datetime(product_monthly['Month_Year'], format='%b-%Y')

# Create plot
plt.figure(figsize=(16, 8))
ax = sns.lineplot(
   x='Date',
   y='Battery_Life_Sentiment_Score',
   hue='Product_ID_Model',
   data=product_monthly,
   marker='o',
   palette='tab10',
   linewidth=2,
   markersize=8
)

# Format axes
ax.xaxis.set_major_locator(AutoDateLocator())
ax.xaxis.set_major_formatter(DateFormatter('%b-%Y'))
plt.xticks(rotation=30, ha='right')
plt.ylim(-1, None)
plt.title('Battery Sentiment Trends - Top 5 Products', pad=20, fontsize=14)
plt.xlabel('Month-Year', labelpad=15)
plt.ylabel('Average Sentiment Score', labelpad=15)

# Configure legend
handles, labels = ax.get_legend_handles_labels()
plt.legend(
   handles, labels,
   title='Products',
   bbox_to_anchor=(1.05, 1),
   loc='upper left',
   borderaxespad=0,
   frameon=False,
   fontsize=9
)

plt.grid(axis='y', linestyle='--', alpha=0.7)
plt.tight_layout()
plt.show()
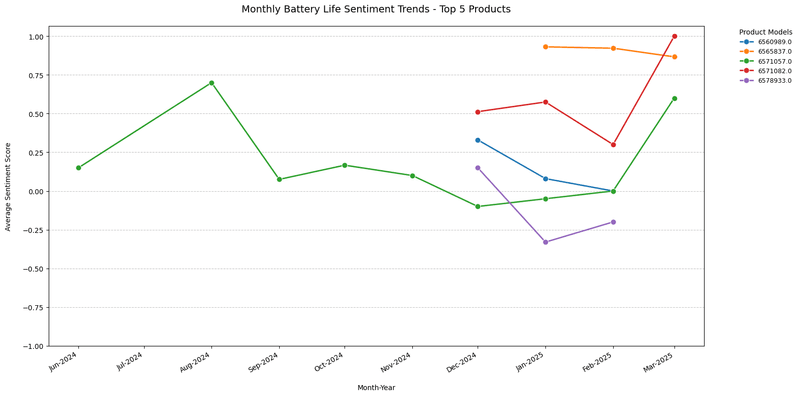
Here is output of script:
Now let's see what details can be conclude from graphs we got:
- Decline from 2020 to 2022: Sentiment scores dropped significantly during this period, moving from slightly negative to a deeper low. This decline likely stems from:
- Product Quality Issues: Problems such as battery degradation, software inefficiencies, or hardware limitations may have frustrated customers.
- Rising Expectations: As technology advanced, customers likely expected longer battery life or better performance, and products may not have kept pace.
- Competitive Pressure: Competitors offering superior battery performance could have highlighted shortcomings in these products, amplifying dissatisfaction.
Sharp Recovery from 2023 to 2025: Sentiment rebounded strongly, reaching a positive level by 2025. This turnaround suggests: - Product Improvements: Companies likely introduced updates, such as enhanced battery technology, better power management, or new product releases that addressed earlier flaws. - Customer Communication: Improved transparency or proactive engagement with customers may have restored trust. - Market Adaptation: Successful alignment with evolving customer needs likely contributed to this positive shift.
Now, about top products, it is visible that majority of products are not having any old reviews clearly indicating that there is high chances they are new in market. This has key implications:
- Fresh Start: New products don’t carry the baggage of older models’ issues, giving them a clean slate to impress customers with better battery performance.
- Latest Technology: These launches likely integrate cutting-edge features—like improved energy density or faster charging—explaining their positive reception.
- Review Timing: Recent reviews reflect initial excitement and satisfaction, often amplified by marketing efforts, which could explain their high ratings compared to older products with more mixed feedback over time.
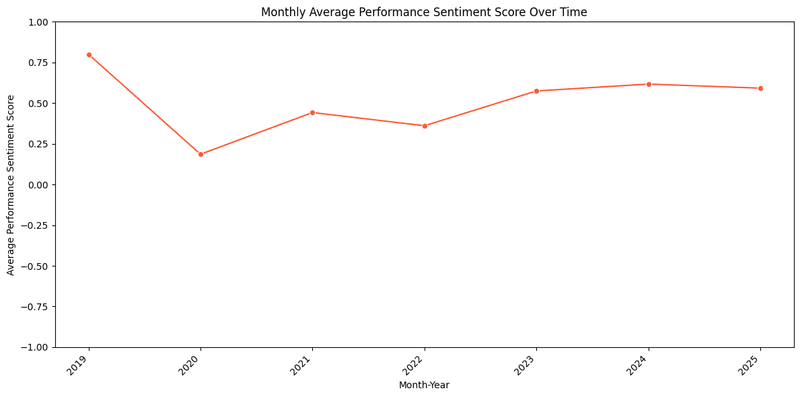
Performance Analysis of Laptops
Now let's perform analysis for performance similar to that of battery. Perfromance is equally critical factor and even slightest issue can result in mass bad reviews, making it crucial for companies.
Here is script and results:
import pandas as pd
import matplotlib.pyplot as plt
import seaborn as sns

# Load data
df = pd.read_csv('data.csv')

# Convert to datetime and extract year
df['Review_DateTime'] = pd.to_datetime(df['Review_DateTime'], format='%Y-%m-%d')
df['Review_Year'] = df['Review_DateTime'].dt.to_period('Y')

# Convert sentiment score to numeric
df['Performance_Sentiment_Score'] = pd.to_numeric(df['Performance_Sentiment_Score'], errors='coerce')

# Group by year and calculate average sentiment
yearly_sentiment = df.groupby('Review_Year')['Performance_Sentiment_Score'].mean().reset_index()
yearly_sentiment['Review_Year'] = yearly_sentiment['Review_Year'].astype(str)

# Create plot
plt.figure(figsize=(12, 6))
sns.lineplot(
   x='Review_Year',
   y='Performance_Sentiment_Score',
   data=yearly_sentiment,
   marker='o',
   color='#FF5733'
)

# Add labels and formatting
plt.title('Yearly Performance Sentiment Trend')
plt.xlabel('Year')
plt.ylabel('Average Sentiment Score')
plt.xticks(rotation=45, ha='right')
plt.ylim(-1, 1)

plt.tight_layout()
plt.show()
Result looks like this:
Here is for top-5 with most number of reviews:
import pandas as pd
import matplotlib.pyplot as plt
import seaborn as sns
from matplotlib.dates import DateFormatter, AutoDateLocator

# Load data
df = pd.read_csv('data.csv')
df['Review_DateTime'] = pd.to_datetime(df['Review_DateTime'])

# Get top 5 products
top_products = df['Product_ID_Model'].value_counts().nlargest(5).index.tolist()
filtered_df = df[df['Product_ID_Model'].isin(top_products)]

# Create month-year format and group
filtered_df['Month_Year'] = filtered_df['Review_DateTime'].dt.to_period('M').dt.strftime('%b-%Y')
product_monthly = filtered_df.groupby(['Product_ID_Model', 'Month_Year'])['Performance_Sentiment_Score'].mean().reset_index()

# Convert to datetime for proper ordering
product_monthly['Date'] = pd.to_datetime(product_monthly['Month_Year'], format='%b-%Y')

# Create plot
plt.figure(figsize=(16, 8))
ax = sns.lineplot(
   x='Date',
   y='Performance_Sentiment_Score',
   hue='Product_ID_Model',
   data=product_monthly,
   marker='o',
   palette='tab10',
   linewidth=2,
   markersize=8
)

# Format axes
ax.xaxis.set_major_locator(AutoDateLocator())
ax.xaxis.set_major_formatter(DateFormatter('%b-%Y'))
plt.xticks(rotation=30, ha='right')
plt.ylim(-1, 1)
plt.title('Performance Sentiment Trends - Top 5 Products', pad=20, fontsize=14)
plt.xlabel('Month-Year', labelpad=15)
plt.ylabel('Average Sentiment Score', labelpad=15)

# Configure legend
handles, labels = ax.get_legend_handles_labels()
plt.legend(
   handles, labels,
   title='Products',
   bbox_to_anchor=(1.05, 1),
   loc='upper left',
   borderaxespad=0,
   frameon=False,
   fontsize=9
)

plt.grid(axis='y', linestyle='--', alpha=0.7)
plt.tight_layout()
plt.show()
Here is what resultant graph looks like:
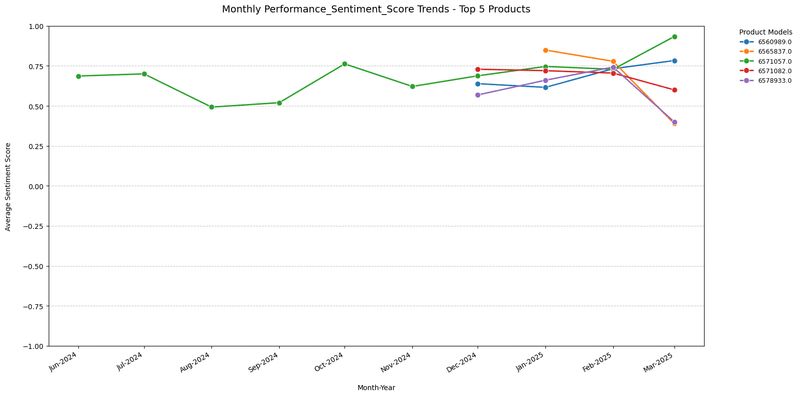
As you can see, we have plotted sentiment in -1.0 to 1.0 scale.
Decline in Sentiment (2019–2020): A sharp drop from 0.75 to 0.25 likely reflects industry-wide challenges, such as the 2020 global pandemic, which disrupted supply chains and delayed product launches, impacting user satisfaction across companies.
Stagnation (2021–2023): Sentiment stabilizing at 0.40–0.50 suggests companies struggled to innovate amid rising competition. ARM’s growing presence in mobile markets during this period, as Apple’s iPhone chips shifted to ARM designs, may have pressured traditional x86 players to adapt, but user reviews remained average.
Incremental Gains (2023–2025): A slow rise to 0.60 by 2024 aligns with Qualcomm’s 2024 launch of Snapdragon X Elite chips for Windows on ARM, improving performance-per-watt and battery life, which likely boosted user sentiment across ARM-based devices.
Plateau at 0.60 (2025): The lack of further growth may reflect Intel’s Arrow Lake desktop CPU launch issues in 2024, where instability problems and a fizzling release disappointed users, capping overall industry sentiment improvements.
Now let's talk about top products:
Initial Stability (June 2024): Most products starting at 0.50–0.75 aligns with Intel’s Lunar Lake mobile CPU launch at Computex 2024, which delivered strong AI PC capabilities and improved user reviews for thin-and-light laptops.
Convergence (Dec 2024): Sentiment converging at 0.50–0.60 may reflect Intel’s Battlemage GPU launch in December 2024, with budget-friendly B580 and B570 models gaining positive user feedback, creating a uniform sentiment across products.
Divergence (Jan–Mar 2025): High performers reaching 0.75 likely tie to Nvidia’s planned ARM chip announcement in September 2025, with early buzz around its high-end consumer focus boosting user expectations. Meanwhile, low performers dropping to 0.00 may reflect Intel’s CEO Pat Gelsinger’s retirement announcement in December 2024, signaling leadership uncertainty and impacting user confidence.
Competitive Pressure: The disparity in sentiment highlights ARM’s growing influence, as Qualcomm’s Snapdragon X Elite success in 2024 and Nvidia’s upcoming ARM chip push Windows on ARM momentum, challenging x86 companies and creating a split in user reviews.
As you can see, this data was enough along with some internet research about external forces to find out why market behaved in specific way. These kind of observations may not always be correct but they are far more useful than random guesswork.
Now let's see build quality, before we move to other kind of visualizations than simple line charts.
Here is script:
import pandas as pd
import matplotlib.pyplot as plt
import seaborn as sns

# Load data
df = pd.read_csv('data.csv')

# Convert to datetime and extract year
df['Review_DateTime'] = pd.to_datetime(df['Review_DateTime'], format='%Y-%m-%d')
df['Review_Year'] = df['Review_DateTime'].dt.to_period('Y')

# Convert sentiment score to numeric
df['Build_Quality_Sentiment_Score'] = pd.to_numeric(df['Build_Quality_Sentiment_Score'], errors='coerce')

# Group by year and calculate average sentiment
yearly_sentiment = df.groupby('Review_Year')['Build_Quality_Sentiment_Score'].mean().reset_index()
yearly_sentiment['Review_Year'] = yearly_sentiment['Review_Year'].astype(str)

# Create plot
plt.figure(figsize=(12, 6))
sns.lineplot(
   x='Review_Year',
   y='Build_Quality_Sentiment_Score',
   data=yearly_sentiment,
   marker='o',
   color='#FF5733'
)

# Add labels and formatting
plt.title('Build Quality Sentiment Trend')
plt.xlabel('Year')
plt.ylabel('Average Sentiment Score')
plt.xticks(rotation=45, ha='right')
plt.ylim(-1, 1)

plt.tight_layout()
plt.show()
Here is output:
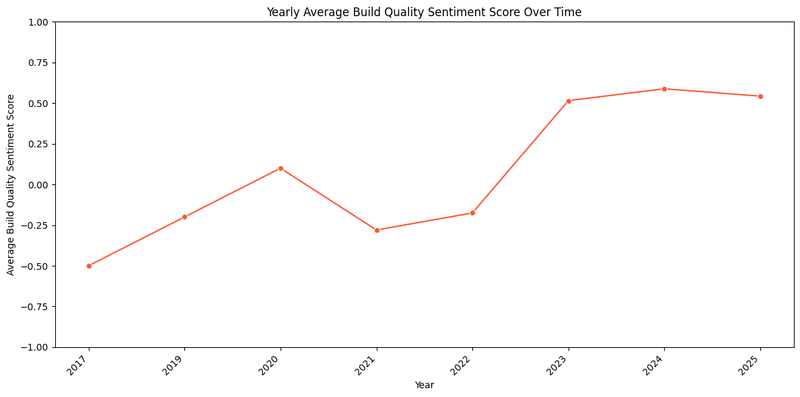
Here it is very simple analysis, all players are constantly working on build quality and it is being reflected in constant improvement in user ratings.
What we can understand is it is required to work on build quality to stay in race as this is not some factor which is being worked on by some only. There is entire shift in reviews which makes it clear that it is must kind of aspect to work on.
Similarly we can analyze keyboard and touchpad sentiments, software sentiments, portability sentiments etc. Rather than repetative analysis, let me move to something different.
We will now see number of negative reviews on important aspects. Positive feedback helps creating marketing campaign and negative feedback helps in creating product better in long term.
Let's start by writing script:
import pandas as pd
import matplotlib.pyplot as plt

# Load data
df = pd.read_csv('data.csv')

# Define aspect columns
aspect_columns = [
   'Overall_Sentiment_Score',
   'Battery_Life_Sentiment_Score',
   'Performance_Sentiment_Score',
   'Display_Quality_Sentiment_Score',
   'Build_Quality_Sentiment_Score',
   'Keyboard_Touchpad_Sentiment_Score',
   'Portability_Sentiment_Score',
   'Software_Experience_Sentiment_Score'
]

# Count positive and negative reviews for each aspect
positive_counts = {}
negative_counts = {}

for aspect in aspect_columns:
   valid = df[aspect].dropna()
   positive_counts[aspect] = (valid > 0).sum()
   negative_counts[aspect] = (valid < 0).sum()

# Set up chart
labels = aspect_columns
x = range(len(labels))
width = 0.35

fig, ax = plt.subplots(figsize=(12, 6))

# Create bars
bars1 = ax.bar([i - width/2 for i in x],
              [positive_counts[label] for label in labels],
              width, color='green', label='Positive')
bars2 = ax.bar([i + width/2 for i in x],
              [negative_counts[label] for label in labels],
              width, color='red', label='Negative')

# Add count labels
for bar in bars1 + bars2:
   height = bar.get_height()
   ax.annotate(f'{int(height)}',
               xy=(bar.get_x() + bar.get_width() / 2, height),
               xytext=(0, 3),
               textcoords="offset points",
               ha='center', va='bottom')

# Format chart
ax.set_ylabel('Review Count')
ax.set_title('Positive vs Negative Reviews by Aspect')
ax.set_xticks(x)
ax.set_xticklabels(labels, rotation=45, ha='right')
ax.legend()

plt.tight_layout()
plt.show()
Here is what results looks like:
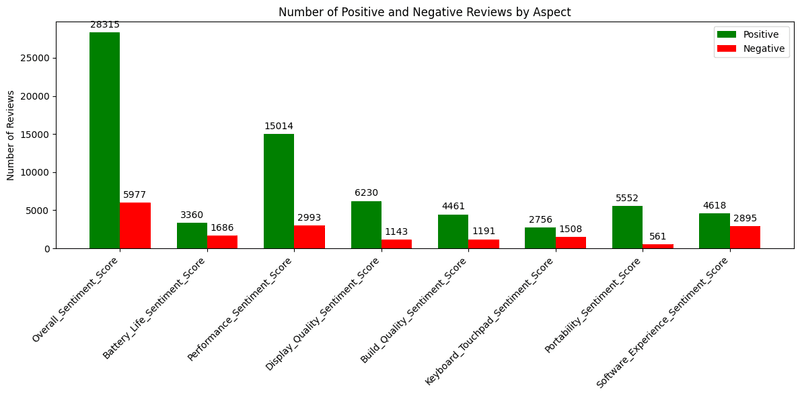
Battery Life (26,315 Positive, 5,977 Negative): Strong positive sentiment aligns with Qualcomm’s 2024 Snapdragon X Elite launch, which emphasized power efficiency, boosting battery life in ARM-based laptops and earning high user praise. The lower negative count suggests companies adopting ARM designs met user expectations.
Performance (15,014 Positive, 2,993 Negative): Positive reviews outnumber negatives, likely due to Intel’s Lunar Lake mobile CPU launch at Computex 2024, which improved performance for AI workloads in laptops, resonating well with users. However, some negatives may reflect Intel’s Arrow Lake desktop CPU issues in 2024, where instability disappointed users.
Display Quality (6,230 Positive, 1,143 Negative): A solid positive-to-negative ratio indicates companies benefited from advancements like Samsung’s 2024 OLED display innovations for laptops, enhancing color accuracy and brightness, which users appreciated. Negatives may stem from budget devices lacking these upgrades.
Build Quality (4,461 Positive, 1,191 Negative): Positive sentiment likely ties to Apple’s 2024 MacBook refresh with ARM-based M4 chips, known for premium build quality, maintaining user satisfaction. Negatives could reflect cheaper devices struggling with durability, a common user complaint.
Keyboard/Touchpad (5,552 Positive, 2,756 Negative): Mixed sentiment suggests uneven quality across companies. Positive reviews may stem from Microsoft’s Surface Laptop 7 (2024) with improved haptics, while negatives could be linked to budget laptops with poor keyboard feedback, a frequent user pain point.
Portability (4,618 Positive, 561 Negative): High positive sentiment aligns with the trend of lighter ARM-based devices, like those using Qualcomm’s Snapdragon X Elite in 2024, catering to mobile users. Low negatives indicate companies successfully addressed portability demands.
Software Experience (2,895 Positive, 1,508 Negative): More balanced sentiment reflects challenges in software optimization. Positives may tie to Windows on ARM improvements in 2024, driven by Qualcomm and Microsoft collaboration, but negatives likely stem from Intel’s Battlemage GPU driver issues in December 2024, frustrating users.
Now we can make some decisions like what companies should do to increase user satisfatcion levels.
Leverage ARM Success: Companies should double down on ARM-based designs, as seen with Qualcomm’s 2024 Snapdragon success, to maintain strong battery life and portability sentiment, key user priorities.
Address Software Gaps: The mixed software sentiment, partly due to Intel’s 2024 GPU driver issues, highlights the need for better optimization, especially as Windows on ARM grows with Nvidia’s 2025 ARM chip plans.
Focus on Premium Features: High display and build quality sentiment, driven by Samsung and Apple innovations in 2024, suggests companies should invest in premium features to differentiate in competitive markets.
Now for better understanding of data, we will create heatmap for sentiments specific to features.
Here is script:
import pandas as pd
import matplotlib.pyplot as plt
import seaborn as sns

# Load data
df = pd.read_csv('data.csv')

# Define sentiment aspects
aspect_columns = [
   'Overall_Sentiment_Score',
   'Battery_Life_Sentiment_Score',
   'Performance_Sentiment_Score',
   'Display_Quality_Sentiment_Score',
   'Build_Quality_Sentiment_Score',
   'Keyboard_Touchpad_Sentiment_Score',
   'Portability_Sentiment_Score',
   'Software_Experience_Sentiment_Score'
]

# Get top 10 products
top_products = df['Product_ID_Model'].value_counts().nlargest(10).index.tolist()
filtered_df = df[df['Product_ID_Model'].isin(top_products)]

# Calculate average sentiment scores
heatmap_data = filtered_df.groupby('Product_ID_Model')[aspect_columns].mean()

# Create heatmap
plt.figure(figsize=(12, 8))
sns.heatmap(heatmap_data, annot=True, cmap='coolwarm', center=0, linewidths=0.5, fmt=".2f")

# Format chart
plt.title('Sentiment Score Comparison - Top 10 Products')
plt.xlabel('Aspect')
plt.ylabel('Product ID')
plt.xticks(rotation=45, ha='right')

plt.tight_layout()
plt.show()
Here is graph we got:
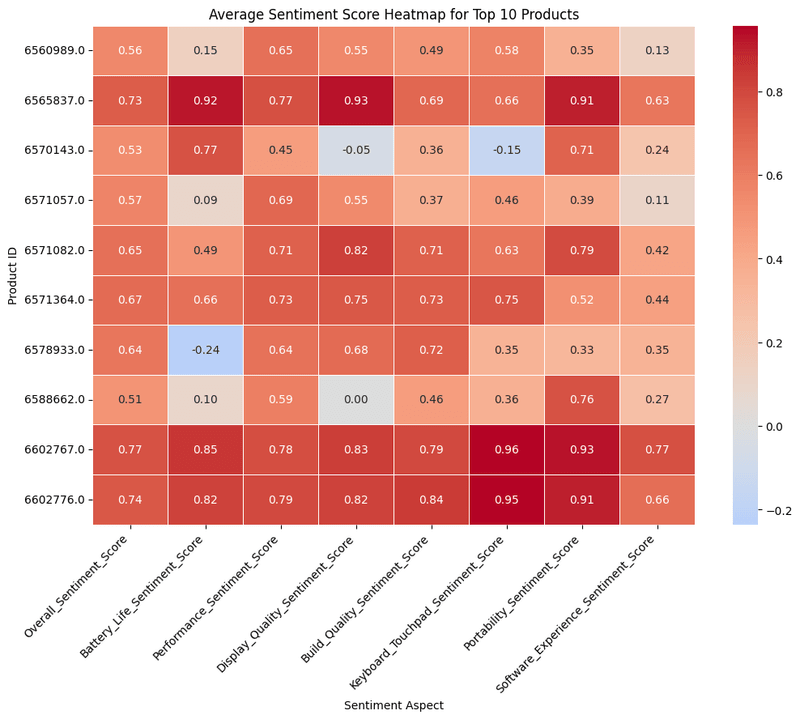
These graph shows same information as the graph we made above this one did. You can create multiple kind of visualizations like box-and-whisker, violin chart, pie charts etc to make visualizations as per your requirements.
Conclusion
This entire review analysis pipeline shows how businesses can move from scattered customer feedback to structured, actionable insights without massive resources.
By combining modern scraping APIs like Unwrangle, AI models like GPT-4o, and simple Python workflows, even small teams can:
-
Detect product weaknesses early
-
Prioritize product improvements
-
Benchmark against competitors
-
Uncover hidden opportunities for growth
Understanding your customers is not just about reading reviews anymore. It is about systematizing that understanding and acting on it faster than anyone else.